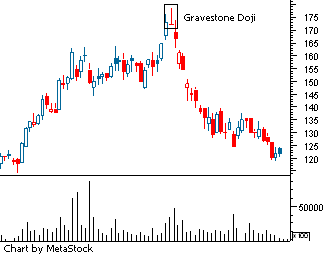
- Gravestone Doji
- A type of candlestick pattern that is formed when the opening and closing price of the underlying asset are equal and occur at the low of the day. The long upper shadow suggests that the day's buying buying pressure was countered by the sellers and that the forces of supply and demand are nearing a balance. This pattern is commonly used to suggest that the direction of the trend maybe be nearing a major turning point.

A gravestone doji pattern is a common reversal pattern used by traders to suggest that a bullish rally or trend is about to reverse. It can also be found at the end of a downtrend, but this version is much more rare. As you can see from the chart, on the day of the gravestone doji (shown within the black box), bearish traders realized that the price was pushed up to unjustifiably high levels so they send the price back up to where the stock opened. The close near the day's low suggests that supply is starting to outweigh demand again.
Investment dictionary. Academic. 2012.
